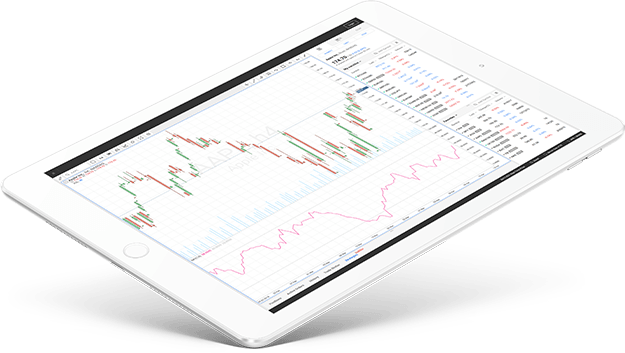
Web platform R StocksTrader

Access to all global markets from a single account.

Multi-asset terminal R StocksTrader combines cutting-edge technologies and a classic design taken to a completely new level. No more unnecessary software and updates – get access to all global financial markets via a web terminal in a familiar web browser.

  • Convenient and easy-to-use
  • Initial deposit is 100 USD
  • Stocks credit line is up to 1:20
  • "Advanced" watchlists
  • More than 12,000 instruments

    Stocks, ETFs and Derivatives (Currencies, Indices, Energy, Metals).

  • Corporate actions support

    Track splits, merges, get dividend payments etc.

  • Level II Market Depth and Time&Sales

    Research and analyze market conditions to the last detail.

  • Investment robots builder

    Free and very useful tool for automated investing.

Investment Conditions

More than 12,000 stocks, Indices and ETFs on bonds, securities, commodities, etc.

  • US Stocks (Deposit from 10,000 USD)
  • US Stocks
  • US stock derivatives
  • European stock derivatives
  • Currency pairs
  • Indices
  • Metal derivatives
  • Oil derivatives
  • Credit Line
  • Minimum Order Volume
  • Maximum Order Volume
  • Financing Fee (Credit Line More Than 1:1)
  • Financing Fee (Credit Line 1:1)
  • Spreads
  • Session Time (execution)
  • Session Time (requests)
  • Stop Out
  • Corporate Actions (mandatory)
  • Corporate Actions (voluntary)
  • Number of investment instruments
  • Swap Free (Only 1:1 Credit)
  • US Stocks
    (Deposit from 10,000 USD)

    • Credit LineUp to 1:20 (or by request)
    • Minimum Order Volume1 share
    • Maximum Order Volume4,999 shares
    • Financing Fee (Credit Line More Than 1:1)- 7%
    • Financing Fee (Credit Line 1:1)0%
    • SpreadsFrom 0.02 USD
    • Session Time (execution)13:30 - 20:00 (UTC)
    • Session Time (requests)24/7
    • Stop Out20%
    • Corporate Actions (mandatory)Applied
    • Corporate Actions (voluntary)-
    • Number of InstrumentsMore than 3,000
    • Swap Free (Only 1:1 Credit Line)
    New
  • US Stocks

    • Credit LineUp to 1:20
    • Minimum Order Volume1 share
    • Maximum Order Volume4,999 shares
    • Financing Fee (Credit Line More Than 1:1)- 7%
    • Financing Fee (Credit Line 1:1)0%
    • SpreadsFrom 0.02 USD
    • Session Time (execution)13:30 - 20:00 (UTC)
    • Session Time (requests)24/7
    • Stop Out20%
    • Corporate Actions (mandatory)Applied
    • Corporate Actions (voluntary)-
    • Number of InstrumentsMore than 3,000
    • Swap Free (Only 1:1 Credit Line)
    New
  • US stock derivatives

    • Credit lineUp to 1:20
    • Minimum Order Volume1 share
    • Maximum Order Volume20,000 shares
    • Financing Fee (Credit Line More Than 1:1)- 7%
    • Financing Fee (Credit line 1:1)0%
    • SpreadsFrom 0.02 USD
    • Session Time (execution)13:30 - 20:00 (UTC)
    • Session Time (requests)24/7
    • Stop Out20%
    • Corporate Actions (mandatory)Applied
    • Corporate Actions (voluntary)-
    • Number of investment InstrumentsMore than 9,400
    • Swap Free (Only 1:1 Credit line)
  • European stock derivatives

    • Credit line
      Up to 1:5
      Up to 1:4
    • Minimum Order Volume1 share
    • Maximum Order Volume20,000 shares
    • Financing Fee(Credit More Than 1:1)-7%
    • Financing Fee (Credit line 1:1)0%
    • SpreadsFrom 0.002
    • Session Time (execution)08:00 - 16:30 (UTC)
    • Session Time (requests)24/7
    • Stop Out20%
    • Corporate Actions (mandatory)Applied
    • Corporate Actions (mandatory)-
    • Number of investment instruments
      84
      120
      7
      12
      38
      37
      25
      9
      36
      21
      24
      29
      20
    • Swap Free (Only 1:1 Credit)
    New
  • Currency pairs

    • Credit lineUp to 1:100
    • Minimum Order Volume1,000 (0.01 lot)
    • Maximum Order Volume10,000,000 (100 lots)
    • Financing Fee (Credit line More Than 1:1)Variable
    • Financing Fee (Credit line 1:1)-
    • SpreadsFrom 1.3 pips
    • Session Time (execution)00:15 - 23:59, Monday - Friday
    • Session Time (requests)24/7
    • Stop Out20%
    • Corporate Actions (mandatory)-
    • Corporate Actions (voluntary)-
    • Number of investment Instruments50
    • Swap Free (Only 1:1 Credit line)
  • Indices

    • Credit line1:100
    • Minimum Order Volume1 contract
    • Maximum Order Volume100
    • Financing Fee(Credit line More Than 1:1)Variable
    • Financing Fee (Credit line 1:1)-
    • SpreadsFrom 1.3 pips
    • Session Time (execution)Variable
    • Session Time (requests)24/7
    • Stop Out20%
    • Corporate Actions (mandatory)-
    • Corporate Actions (voluntary)-
    • Number of investment Instruments9
    • Swap Free (Only 1:1 Credit line)
  • Metal derivatives

    • Credit line 1:100
    • Minimum Order Volume1
    • Maximum Order Volume250,000
    • Financing Fee(Credit line More Than 1:1) Variable
    • Financing Fee (Credit line 1:1)-
    • SpreadsFrom 1.3 pips
    • Session Time (execution) 1:00 AM - 11:55 PM, Mon-Fri
    • Session Time (requests)24/7
    • Stop Out20%
    • Corporate Actions (mandatory)-
    • Corporate Actions (voluntary)-
    • Number of investment Instruments2
    • Swap Free (Only 1:1 Credit line)
  • Oil derivatives

    • Credit line1:20
    • Minimum Order Volume10
    • Maximum Order Volume500,000
    • Financing Fee(Credit line More Than 1:1) Variable
    • Financing Fee (Credit line 1:1)-
    • SpreadsFrom 1.3 pips
    • Session Time (execution)3:00 AM - 11:15 PM, Mon-Fri
    • Session Time (requests)24/7
    • Stop Out20%
    • Corporate Actions (mandatory)-
    • Corporate Actions (voluntary)-
    • Number of investment Instruments2
    • Swap Free (Only 1:1 Credit line)
  

Two position accounting models

Netting and hedging accounts for effective investment.

  • Netting

    In the netting model, you can open only one position in an investment instrument. If you attempt to open one more order in the same instrument, either both transactions will be closed, or the volume of the existing position will be changed, or the existing position will reverse in the opposite direction.

  • Hedging

    Using the hedging model, you can open several positions in the same instrument in different directions, in case there is enough margin for opening and maintaining them.

When opening a new R StocksTrader account, you can choose one of these position accounting models.

R StocksTrader

Together with R StocksTrader you will achieve your investment goals

Even the most sophisticated investors will find a lot of options and features in R StocksTrader platform to satisfy their requirements and demands. Unique watchlists, multiple windows, and a countless amount of viewing methods – all these things are intended to provide as convenient investing conditions as possible. Investors have an opportunity to enjoy the fastest charts in the industry and advanced tools of technical analysis from anywhere in the world in any browser.

Personal customization

  • Watchlists

    Be more efficient in managing your investments with the help of custom and system watchlists. Necessary instruments can be added to custom watchlists or removed from them, and system watchlists, such as Top losers, Top gainers, Volume leaders, are updated in real-time.

  • Investing from charts

    Active orders and deals are synchronized with charts automatically. Placing and managing Stop and Limit orders are always easy, whether that be touchscreen or "Drag-and-drop" device.

  • One-Click Investing

    This service allows you to enter positions fast and safely and makes investment operations more comfortable in order to save your time.

Free Automated Strategy Builder

The unique tool in R StocksTrader terminal, which will allow you to build, run, and test your investment strategies. You will have an opportunity to create efficient investment algorithms with uncomplicated features and functionality to help you to reduce manual investing time. Using the strategy builder requires no programming skills or knowledge.

  • For free

    No matter how you invest, on real or demo accounts, no additional fees will be charged for that. R StocksTrader is a cloud terminal, so your personal account and the strategies that are kept in it are always safe and secure.

  • Template Strategies

    Use template strategies – you can Edit, optimize, and run them to perfection. Using them, you will quickly understand how automated strategies are designed and then try to create your own.

  • Quick testing

    In comparison with similar methods, the one that is used in R StocksTrader platform is faster and provides more accurate results. Historical data that goes back to 1970 is available for backtesting your long-term strategies.

  • Dedicated Support

    Our 24/7 online Live Support is always ready to help you in solving your issues.

Frequently Asked Questions (FAQ)

  • How to open an account in R StocksTrader platform?

    1. If you already have a RM Investment Bank Members Area, then log in and select "Open a R StocksTrader-account" or "Open a Demo R StocksTrader-account" from the "Live Account" menu. Fill in all fields and click "Continue" button.

    2. If you are not a RM Investment Bank client yet, then you will have to register. To do so, follow the link. Fill in all required fields of the registration form, get access to the Members Area, and follow the instruction in par. 1.

  • Can I open a demo account?

    Yes.

  • How can I log in to the investment platform?

    The R StocksTrader investment platform is located at https://stockstrader.rmib.com. To log in to the platform, you have to enter Members Area login (your E-mail) and password.

  • What methods of deposit and withdrawal funds are available for me?

    Deposit & Withdrawal of funds from the R StocksTrader account are possible through more than 20 payment systems, a complete list of which is available on the page "Deposit & Withdrawal Methods".

  • Why should I try R StocksTrader’s platform?

    • 12,000+ instruments: Stocks, Indices, ETFs, Currency pairs
    • No market data fee. No monthly fee. No minimum volume requirements
    • All corporate events supported and handled by the system automatically
    • Strategy Builder. No programming skills required
    • Order management after and before investment sessions: place and modify Take Profit, Stop Loss, Limit, and Stop even when the market is closed, and they will be executed after the session starts.
    • You can chart two or more assets on the same chart for comparison.
    • See the potential margin impact for an order.
    • Linking scheme. Any instrument you click in the terminal linked with one or multiple charts. No need to spend time finding the instrument on charts.
    • Multiple chart layouts. Customize, save and use different investor's workspaces.
    • User Friendly and easy to navigate
    • Watchlist for faster navigation and reference
    • One click Investing, accelerated investments and avoid confirmations of each deal
    • Web Based: no download or installation needed
  • What is a financing fee (Interest)?

    At the end of each day, your open investment positions may be subject to a charge called a Financing Fee. The Financing Fee value, on which interest is based, may change from time to time without a prior notification to clients.

    • Financing fee = price х volume х Financing fee % /100/360
    • Twitter, 100 shares, buy, Financing fee = 25 х 100 х -7% /100 /360 = -$0.49

    Please note that on the night of Friday to Saturday the Financial Fee is tripled for Stocks, Currencies, Indices.

  • How to invest in Stocks on R StocksTrader?

    Example of Buying Facebook Stock:

    1. Choose a particular asset.

    For example, you're interested in investing in Facebook stocks. The price is currently 116.88/117.03 USD.

    2. Sell or buy.

    You choose to buy 50 stocks at the offer price 117.03, because you believe the market will rise (otherwise you could sell at the bid price 116.88 if you believe the market will fall).

    3. Margin.

    In this example, your total exposure is 50 stocks x 117.03 (buy price) = 5,851.5 USD.

    The margin required on Facebook stocks is 5%, so to open this transaction you would need to have 5,851.5 USD x 5% = 292.57 USD in your account (or the equivalent in other currency).

    4. Closing your position.

    Over the course of the day, the market rises, and Facebook stock price is 132.52/132.67 USD. You choose to close your position at the price 132.52.

    5. Calculating Profit/Loss

    Profit / loss is calculated based on the difference between your opening and closing prices, in points.

    In this case: 132.52 – 117.03 = 15.49 USD.

    You bought 50 stocks, and the market moved in your favor.

    Therefore, your gross profit is 50 * 15.49 = 774.5 USD.

  • Order Types and Definitions used in the Platform

    Market Order
    Buy or sell order at a current market price. Best execution price guaranteed by execution venue. The Requested Order price is not guaranteed.

    Buy Limit Order
    Pending order to buy below the current market price. Trigger condition: the current Ask price is less or equal to declared order price. The Requested Order price is guaranteed. The Execution price is better or equal to the Declared Price.

    Buy Stop Order
    Pending order to buy above the current market price. Trigger condition for FX/ Indices: current ask price is greater or equal to declared order price. Trigger condition for Stocks/ Crypto: last price is greater or equal to declared order price. Requested Order price is not guaranteed.

    Sell Limit Order
    Pending order to sell above the current market price. Trigger condition: the current Bid price is higher or equal to declared order price. The Requested Order price is guaranteed. The Execution price is better or equal to the Declared Price.

    Sell Stop Order
    Pending order to sell below the current market price. Trigger condition for FX/ Indices: current bid is less or equal to declared order price. Trigger condition for Stocks/ Crypto: last price is less or equal to declared order price. Requested Order price is not guaranteed.

    Expiration Time Availability (Buy Limit, Buy Stop, Sell Limit, Sell Stop):

    Good Till Cancelled - Order will be valid immediately after setting until cancelled.
    Day Order - Order will remain until the end of the day, in which case it will be cancelled if not triggered.
    End of Week - Order will be valid till the end of the week, which is Friday.
    End of Month - Order will be valid till the last Business day of the month.
    Select Date and Time - Personal Preference of chosen validity.

    Stop Loss Order
    Stop order to close a deal. Trigger condition for FX/ Indices: current bid (for BUY deals) or current ask (for SELL deals) reaches the Stop Loss level. Trigger condition for Stocks/ Crypto: last price reaches the Stop Loss level. Requested Order price is not guaranteed.

    Trailing Stop
    Trailing Stop is a kind of dynamic Stop Loss that follows the price. When you set Trailing Stop, you specify the number of pips between the current price and Trailing Stop. If the market moves your way, Trailing Stop will follow the price and will get triggered only once the price reverts and moves the number of pips specified. The current price value depends on the instrument type:

    Stocks and cryptocurrencies: "Last price"
    Other instruments (long positions): "Bid price"
    Other instruments (short positions): "Ask price"

    Take Profit Order
    Limit order to close a deal. Trigger condition: current bid (for BUY deals) or current ask (for SELL deals) reaches the Take Profit level. Requested Order price is guaranteed. Execution price is equal or better then declared in Take Profit.

    Stop Out Order
    Stop order to close a deal. Trigger condition: Margin level is less or equal to Stop Out Level.

    Definitions

    Order Type - Market, Limit, Stop, Stop Loss, Take Profit, Stop Out.
    Order Status - Active, in execution (filling), filled, cancelled, rejected.
    Declared Order Price – the order price before the order triggered for execution.
    Filled Order price – the order price after the order has been filled.
    Last price – the price of the last executed transaction on the execution venue. Stock instruments indicate the last price on the financial chart.
    Deal – the result of an executed order. Any filled order opens or closes a deal.
    Deal status – open, closing, closed.

  • Which Execution Rules for Stocks exist in the platform?

    1. Stop or Limit orders become active once created. Only active orders can be updated/canceled during open market hours. All active orders can be found in "Active Orders" tab of account summary in the client’s investment platform.

    2. Any order, satisfying one of the conditions below, changes the status to "Filling"

      2.1 Market order submitted;
      2.2 Stop Loss, Take Profit, Stop Out orders once created;
      2.3 Stop, Limit order declared price triggered.

    3. All orders with the status "Filling" can be found in Active Orders tab of account summary in the client’s investment platform until status changed by the system to "filled" or "rejected".

    4. All orders with the status "Filling" automatically cancelled by the system at the end of every day.

    5. When an order is executed, a related Deal is opened or closed at the Filled order price and the order status is changed to "filled".

    6. When an order is canceled by the user or rejected by the system, the status of the order is changed to "canceled" or "rejected" accordingly.

    7. All "filled", "cancelled" and "rejected" orders can be found in the Trade Blotter tab in the account summary in the client’s investment platform.

    8. All orders are executed only during the instruments sessions. Order management after and before sessions: place and modify Take Profit, Stop Loss, Limit, and Stop even when the market is closed. They will be executed after the session starts.

    9. In case the Account Margin Level is less or equal to the Stop Out Level, the system sends a Stop Out order(s) to close all opened deals. In the case a Stop Out order is cancelled by the execution venue and the Account Margin Level is still less or equal to Stop Out level, the system sends Stop Out order(s) again.

    10. Stop Loss, Take Profit, Stop Out or Market orders that close a deal with the status "Filling" change the related deal status to "closing". When the related order is "filled", the deal becomes "closed". In case the related order is rejected, the deal becomes "open" again.

    11. All "open", "closing" and "closed" deals are indicated in the Positions tab of account summary in the client’s investment platform.

    12. At the end of the day based on server time, all closed deals are converted into account currency and become trades in the client’s investment platform.

    13. All trades along with balance transactions (Deposit/Withdraw) and cash dividends in the case of Stock investing can be found in History tab of account summary in the client’s investment platform.

    14. RM Investment Bank relies on third-party execution venues for pricing and available volumes, therefore execution of the client’s orders will depend on the pricing and availability of liquidity at the execution venues. Although RM Investment Bank executes all orders placed by the clients, it reserves the right to decline an order of any type or order could be declined by the execution venue.

    15. Orders sent near the opening of investing time: Please note that markets can be especially volatile near the opening of an investment session, with prices and available volume often changing rapidly and data feeds from various markets potentially being slow or temporarily unavailable. RM Investment Bank cannot guarantee that orders sent near the opening of investing necessarily will receive the best posted price. You may want to consider the use of limit orders at the opening, although market orders should be used if you want a higher certainty of getting a fill. In case Take Profit or Stop Loss orders are rejected, Take Profit and Stop Loss levels are removed.

  • Which corporate actions exist in the platform when investing in Stocks?

    Long Positions
    A client holding a long position on the ex-dividend date will receive the applicable dividend in the form of a cash adjustment, credited to the relevant investment account. Transaction can be found in History Tab in the client’s platform - "Cash Corrections".

    Short Positon
    A client holding a short position on the ex-dividend date will be charged the applicable dividend in the form of a cash adjustment, debited from the relevant investment accounts free equity. Transaction can be found in History Tab in the client’s platform - "Cash Corrections".

    Dividends procedure
    Cash dividend transactions debit/credit account balance on ex-dividend day at 15:00 server time. Transaction can be found in History Tab.

    In case of Long Position Cash Dividend Amount is:

    Dividend per stock * Volume

    where:
    Volume = Contracts * Contract size

    In case of Short Position Cash Dividend Amount is:

    (-1) * Dividend per stock * Volume

    where:
    Volume = Contracts * Contract size

    Stock splits
    In the event of a stock split, the appropriate adjustment on the client’s position shall be reflected on the investment account in accordance with the announced stock split.

    Split procedure
    Splits procedure runs on the server every day at 15:00 server time. During the procedure all active pending orders (Limit, Stop) for related stock will be removed.

    Weighted average price and sum volume are calculated separately for all open deals in short and all open deals in long of an instrument and are assigned as new open price and new volume for the deal with maximum volume for long and short deals accordingly. In case a deal receives fractional stocks, such stocks will be liquidated for cash transaction – "Split cash correction". Volume of other deals for related instrument will be reset to 0 and moved to History Tab.

    Fractional stock adjustment
    In the event a corporate action results in a fractional position, RM Investment Bank reserve the right at its own discretion to credit the outstanding fractional component as a cash adjustment to be credited to the client’s investment account.

    Other Corporate Actions
    In the event of a stock being de-listed, merged, acquisitioned, tendered, spinned-off, the client’s position will be closed at the last market price.

    RM Investment Bank bears no responsibility for notifying the client regarding announcements of corporate actions.

  • How does the netting position accounting model differ from the hedging one?

    Netting

    The netting position accounting model allows you to have only one open position in an investment instrument. Conditions for any investment instrument using the netting model:

    • You can’t open two positions in different directions (short and long) of the same volume – they will close each other.
    • If the volume of your new long position is bigger than your existing short position (or vice versa), the existing position will reverse in the opposite direction.
    • If the volume of your new long position is smaller than your existing short position (or vice versa), the existing position volume will reduce by the opposite position volume.
    • Open orders in the same direction are summarized.

    In any case, there will always be only one position in an investment instrument.

    Hedging

    The hedging account allows you to open as many positions in the same instrument in different directions as you want, in case there is enough margin for opening and maintaining them.

    If you work with the hedging accounting model and already have an open position in some instrument and want to open a new one, you will just get another open position. Unlike the netting model, in the hedging model opening a new position has no influence on existing ones.